
 FreshPrep Order Rate Prediction Project
- 8 mins UBC MDS Project
FreshPrep: Order Prediction Rate
Note: As part of my NDA and to protect the privacy of FreshPrep, confidential information is being withheld, such as descriptive statistics of actual data.
Video: A (fun) overview of the FreshPrep project and the dashboard
Background
FreshPrep is an innovative, eco-friendly Vancouver based meal kit company. They provide customers with a variety of quick to prepare healthy meal kit collections, for any diet. Customers are delivered meal kits consisting of proportioned and/or pre-prepared ingredients, along with an easy to follow recipe card for a quick meal preparation.
FreshPrep customers can classify themselves as either:
Active – orders are automatically billed from week to week.
Paused – orders are not automatically billed (i.e. they are skipped) from week to week.
FreshPrep orders can be classified as:
Billed – orders are charged and then delivered to the customer.
Skipped – orders are not charged or delivered to the customer.
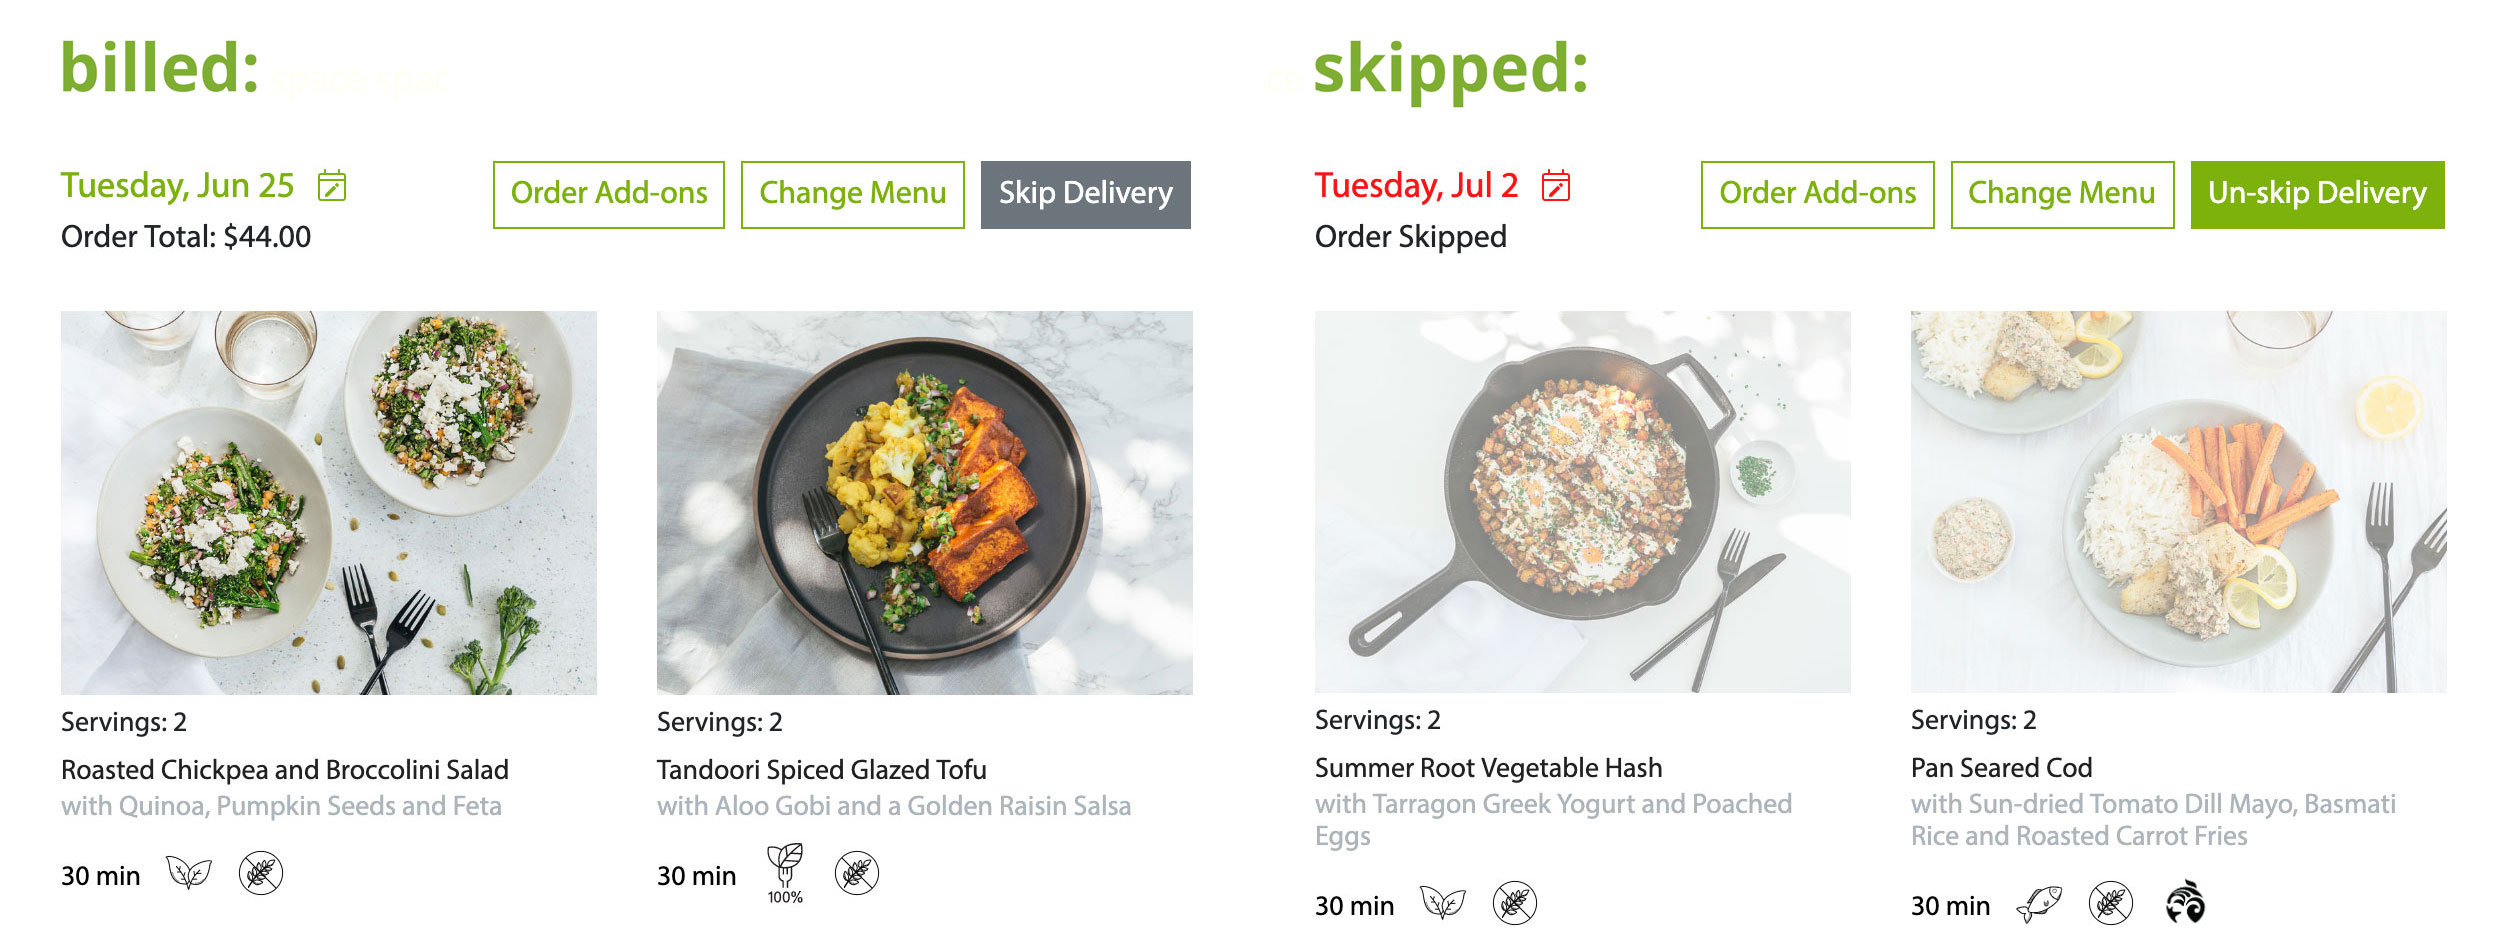 Fig 1: An example of a billed vs a skipped order for a particular week
Proposal
As Master of Data Science (MDS) students, our capstone team’s project was to build an effective model which would predict the probability of future customer orders. Specifically, which customers would bill orders and which would skip orders in the upcoming weeks. This was done by our model producing a probability for each active and paused customer. Any probability which was close to 1 indicated a customer is very likely to order, while a number close to 0 indicated a customer is very unlikely to order.
This information allowed FreshPrep to forecast which specific customer would be ordering and the total number of orders in the upcoming weeks. In addition, it also helped FreshPrep focus marketing on uncertain customers who hover around a 50% probability of ordering.
Our approach:
- Data Wrangling
- Exploratory Data Analysis (EDA)
- Feature Engineering
- Predictive Modeling
- Data Visualization/Product
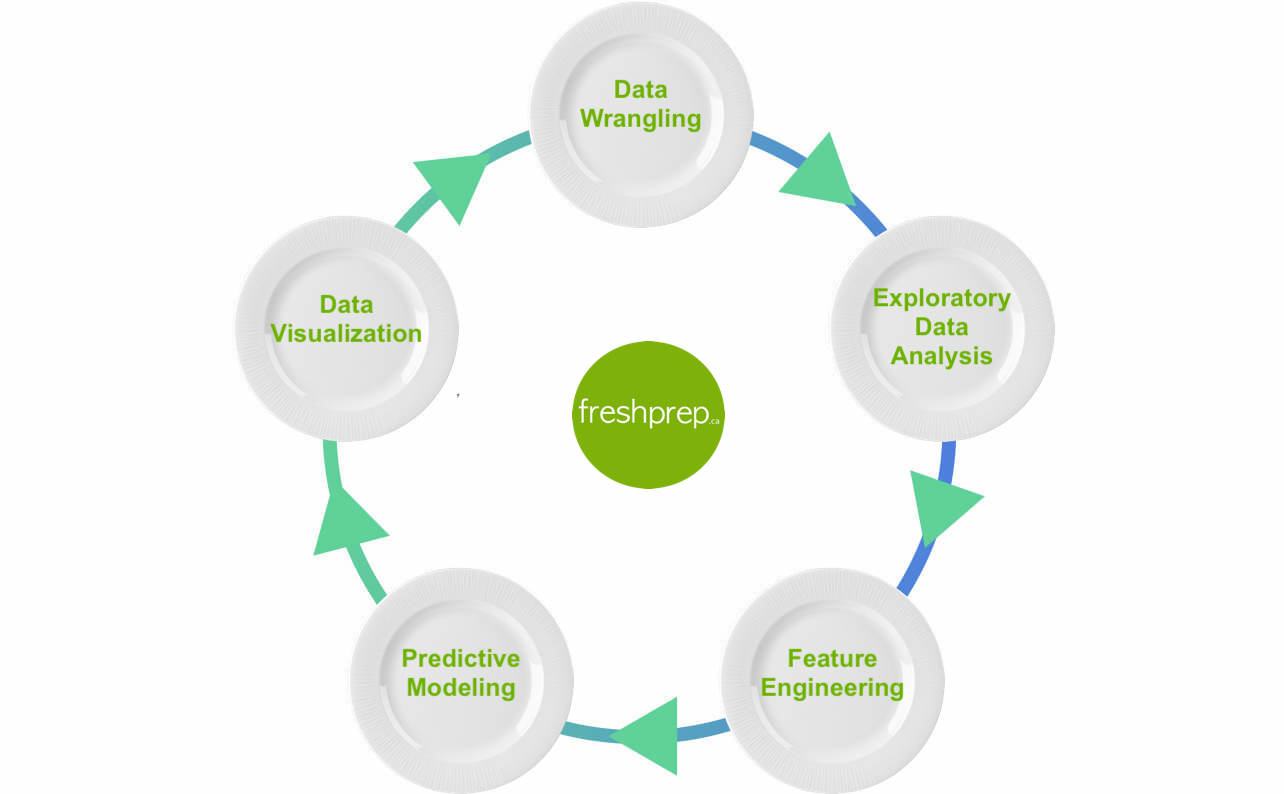 Fig 2: Project workflow
Data Wrangling
A substantial amount of data was provided to us within a PostgreSQL relational database. After our initial examination, we spent a significant amount of time creating a clean and relevant dataset within R for further exploration.
Exploratory Data Analysis (EDA)
Understanding FreshPrep’s business and data was extremely valuable in moving forward with our project. From our cleaned dataset, we uncovered many valuable insights for FreshPrep, specifically:
- Active and paused customers had very different calculated billed order rates.
- Active customer’s calculated billed to skipped order ratios were relatively equal among all customers. This not only provided us with a very workable, well balanced dataset but it was also quite obvious that active and paused customer data would greatly benefit with separate models.
- Customers tend to have similar order patterns from previous weeks.
- Active customers tend to plan their orders further out from the delivery date than paused customers.
- Customers who have a higher number of dietary restrictions (7 or 8) tend to order more often than customers with less dietary restrictions. This helped illustrate that the number of dietary restrictions have an effect on a customer’s billed order rate.
- Customers who tend to customize their orders more often (greater than 80%) tend to skip orders more often than customers who customize 20-80% of the time.
Feature Engineering
Engineering meaningful features for our model was a challenging area of our project and took a significant amount of time with the amount of data we had received. Our goal was to determine and/or create features which were the strongest predictors for forecasting customer order probabilities. Additionally, the insights discovered from our EDA were very helpful in engineering our final 14 predictive features. The features which were most predictive were:
- Each customer’s historical billed order rate was ‘smoothed’ using an estimation method, known as Empirical Bayes, to account for customers with lesser order histories.
- There were a number of restrictions which restricted us from decomposing the data into seasonality and trend components. Thus, to capture seasonality, we used the average weekly billed order rate from the corresponding week the year before. By doing this, we assumed the trend of order rates remained constant.
- The customer’s previous week order decision (billed or skipped).
- Each customer’s billed or skipped order behavior for up to 5 weeks (lags) before a given predictive week.
- The number of weeks a customer has existed at the time of a particular order.
- The month a customer has joined FreshPrep.
- The customer’s subscription plan price.
- The customer’s latitude and longitude delivery location.
- Whether the customer has a beef dietary restriction.
Predictive Modeling
Our model answered 2 primary questions for FreshPrep. The simpler, ‘how many orders will there be each week?’ And the harder, ‘who will order each week?’ Our team undertook the latter harder question which also provided an answer to the former simpler question.
We chose Logistic Regression as our model for order predictions. This provided us with more interpretable regression weights as well as, more trustworthy probabilities than other models we tried, such as Random Forest. Additionally, this decision also proved to be instrumental in providing a rational which was comprehensible to FreshPrep of which factors drove the model’s predictions.
We trained 2 separate models, one for active customers and one for paused. Both models gave a probability of ordering for each customer. These probabilities are then summed up to provide the total number of expected orders for a given week. For active customers we used this value to give the number of predicted billed orders for a week. However, for paused customers we also used their most trusted behavior for this prediction. Specifically, any probabilities less than 0.5 (our threshold) were assigned a value of 0 (skipped order) while any probabilities greater than 0.5 were assigned a value of 1 (billed order). Similarly, these values were then summed up as the number of expected billed orders for a week for paused customers. This step was done as most customers had a paused status and adding up small probabilities (such as 0.01*1000) lead to overestimation of the number of predicted orders.
Our models could predict the total number of expected billed orders for up to three weeks out. This provided FreshPrep with the opportunity to plan their resources and marketing efforts more efficiently.
How did we do?
Our models preformed with a Mean Absolute Percentage Error (MAPE) of 4.61 on the total number of billed orders from June 2018 to June 2019. What does this mean? In a week where our model predicts 100 orders, the error can be up to +/- 5 orders. However, when we focused on orders only in 2019, giving the models more training data, they performed with a MAPE of 1.5. This would mean the models could predict an error of +/- 1.5 orders when predicting 100 billed orders for a week.
Data Visualization/Product
As part of our final deliverable, we developed an interactive Tableau dashboard for FreshPrep to visualize the predictions produced from our models. The dashboard also allowed FreshPrep to further ‘drill down’ on their data and the predictions for other business driven insights. For example, they could visualize customers in specific demographics, with certain diet restrictions (such as vegans) etc.
The complete project (documentation, scripts, Tableau framework etc.) was delivered to FreshPrep as a reproducible pipeline for easy installation and operation. This included a self-contained Docker image for easy portability and integration in to FreshPrep’s existing infrastructure.
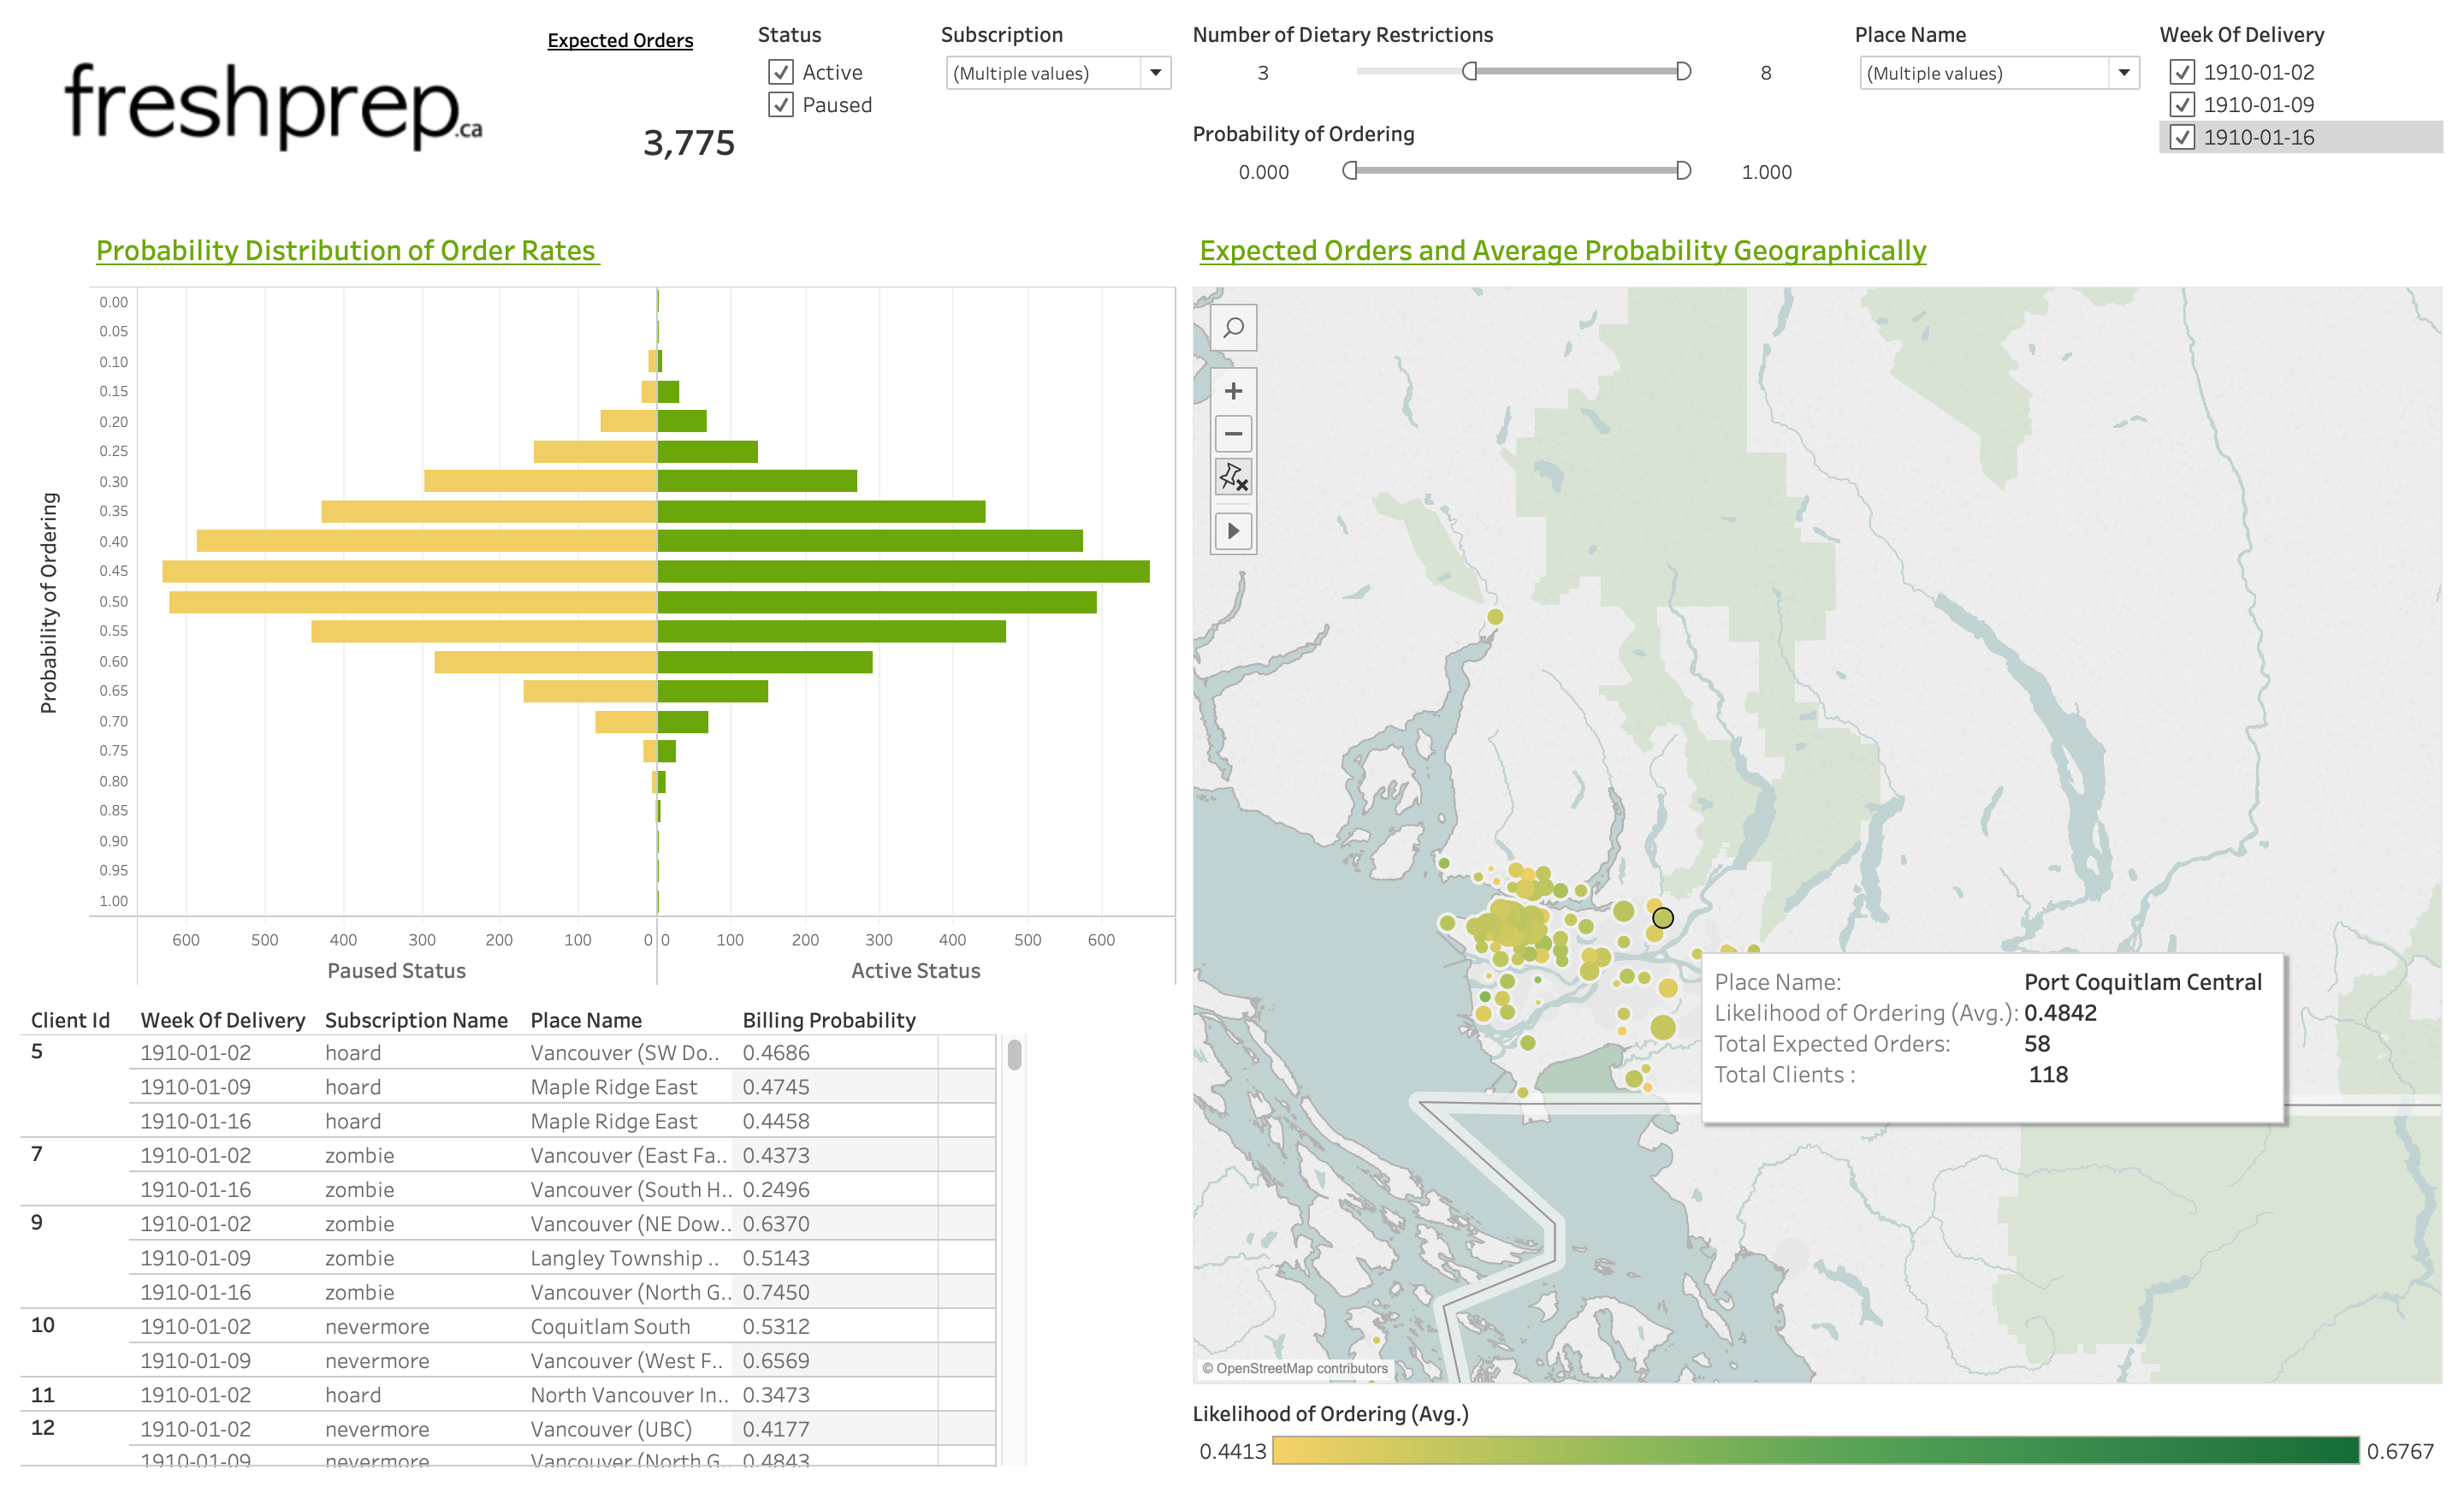
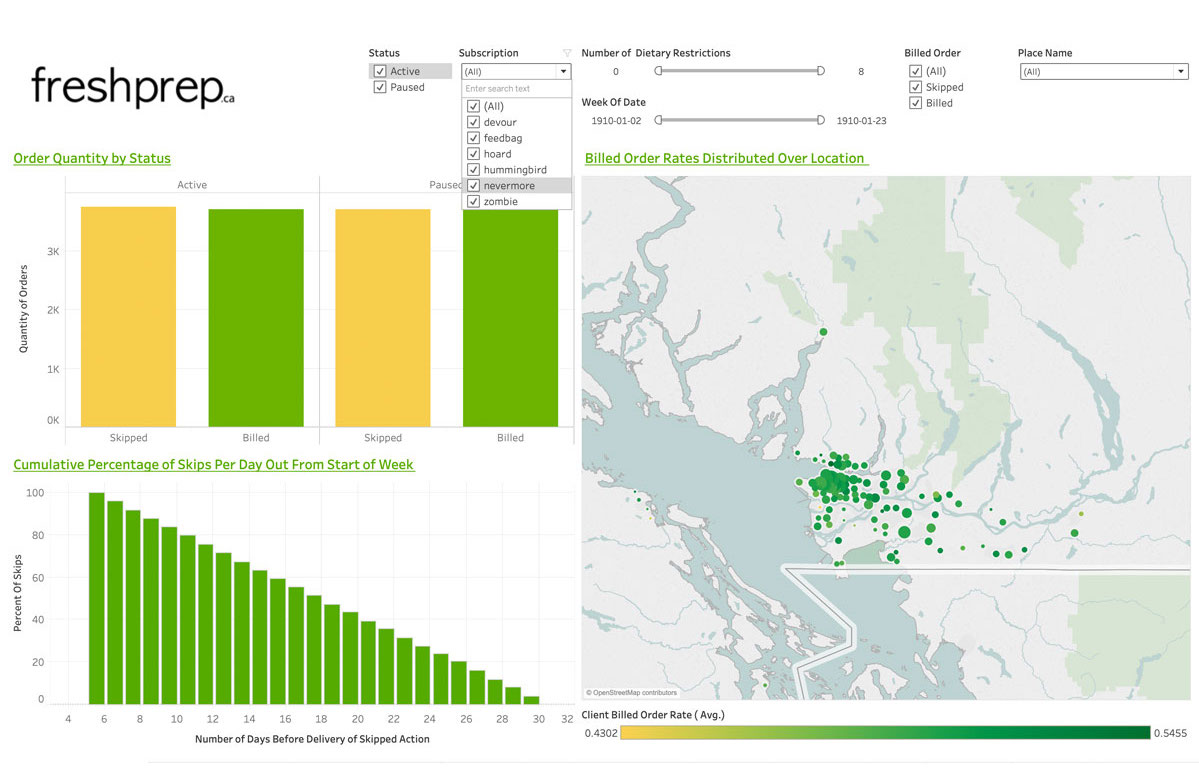 Fig 3 and 4: FreshPrep dashboard examples
Potential Enhancements
If we had more time allocated for our capstone project there were a number of areas we could have further explored, such as:
- Running these models solely on FreshPrep’s undecided customer groups and add their expected order values to the decided customer groups (opt-in for paused and opt-out for active).
- Incorporating the effect of holidays on weekly order rates.
- The effects of other features (recipes, customizations etc.) on weekly order rates.
Lessons Learned
- Understanding exactly what a client envisions as a successful project is very important.
- Data Wrangling is more of a continual process than a step.
- EDA is a very crucial step for attaining confidence in the data before moving on to machine learning.
- Features with a high accuracies are not necessarily beneficial for a model.
- Always be skeptical when your model obtains an accuracy of 99%.
Overall, I found the capstone project an enlightening experience in not only applying theoretical skills practically, but also how beneficial working with a team having a diverse set of skills enhances a data science project.
Acknowledgments
I’d like to thank my team members Hayley Boyce, Orphelia Ellogne and Rachel Riggs. Also, a special thank you to our faculty supervisor Micheal Gelbart and our partners from FreshPrep.
